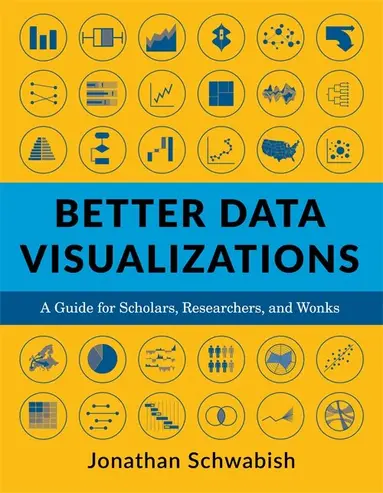
Better Data Visualizations
- Vikt 1,14 kg
317 krhos Bokus · exkl. frakt
92 kr skillnad mellan billigaste och dyraste butik i lager
Dubbelkollade priser
Jämför 5 butiker
- Bokus, 317 kr, frakt enligt butiken. Till butik (öppnas i ny flik)
I lagerFrakt: se butikenDubbelkollad 05:51
317 kr
Lägst
- Buyersclub, 369 kr, frakt enligt butiken. Till butik (öppnas i ny flik)
I lagerFrakt: se butikenDubbelkollad 22 okt. 06:26
369 kr
- Akademibokhandeln, 409 kr, frakt enligt butiken. Till butik (öppnas i ny flik)
I lagerFrakt: se butikenDubbelkollad 05:53
409 kr
- Adlibris, 382 kr, frakt enligt butiken. Till butik (öppnas i ny flik)
Slut i lagerFrakt: se butikenDubbelkollad 05:10
382 kr
- Storytel Books, 389 kr, frakt enligt butiken. Till butik (öppnas i ny flik)
Slut i lagerFrakt: se butikenDubbelkollad 06:00
389 kr




Priser från butikernas flöden kan ha ändrats: det är priset hos butiken som gäller, så kontrollera det innan du handlar.
Prishistorik
Köp nu eller vänta?
Just nu kostar produkten 317 kr — 7 kr över det lägsta vi sett på 1 månad.
Under den tiden har det oftast legat runt 320 kr.
Pris idag
317 kr
- Lägst
- 310 kr
- Snitt
- 323 kr
- Högst
- 369 kr
| 2026-09-09 | 369 kr · Lägst hos Buyersclub |
|---|---|
| 2026-09-15 | 310 kr · Lägst hos Bokus |
| 2026-09-18 | 312 kr · Lägst hos Bokus |
| 2026-09-21 | 314 kr · Lägst hos Bokus |
| 2026-09-23 | 315 kr · Lägst hos Bokus |
| 2026-09-24 | 313 kr · Lägst hos Bokus |
| 2026-09-27 | 315 kr · Lägst hos Bokus |
| 2026-09-28 | 316 kr · Lägst hos Bokus |
| 2026-10-02 | 318 kr · Lägst hos Bokus |
| 2026-10-03 | 319 kr · Lägst hos Bokus |
| 2026-10-05 | 320 kr · Lägst hos Bokus |
| 2026-10-07 | 321 kr · Lägst hos Bokus |
| 2026-10-11 | 320 kr · Lägst hos Bokus |
| 2026-10-13 | 318 kr · Lägst hos Bokus |
| 2026-10-16 | 319 kr · Lägst hos Bokus |
| 2026-10-17 | 318 kr · Lägst hos Bokus |
| 2026-10-19 | 319 kr · Lägst hos Bokus |
| 2026-10-20 | 316 kr · Lägst hos Bokus |
Om produkten
Now more than ever, content must be visual if it is to travel far
Läs merLäs mindre
Readers everywhere are overwhelmed with a flow of data, news, and text. Visuals can cut through the noise and make it easier for readers to recognize and recall information. Yet many researchers were never taught how to present their work visually. This book details essential strategies to create more effective data visualizations. Jonathan Schwabish walks readers through the steps of creating better graphs and how to move beyond simple line, bar, and pie charts. Through more than five hundred examples, he demonstrates the do's and don'ts of data visualization, the principles of visual perception, and how to make subjective style decisions around a chart's design. Schwabish surveys more than eighty visualization types, from histograms to horizon charts, ridgeline plots to choropleth maps, and explains how each has its place in the visual toolkit. It might seem intimidating, but everyone can learn how to create compelling, effective data visualizations. This book will guide you as you define your audience and goals, choose the graph that best fits for your data, and clearly communicate your message.
Specifikationer
Fakta
- Vikt
- 1,14 kg
- GTIN
- 09780231193115
Uppgifter från tillverkare och butiker.