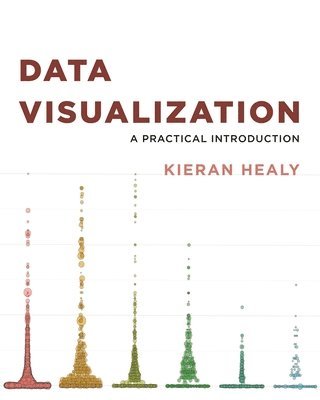
Data Visualization
- Vikt 0,73 kg
519 krhos Buyersclub · exkl. frakt
50 kr skillnad mellan billigaste och dyraste butik i lager
Dubbelkollat idag
Jämför 4 butiker
- Buyersclub, 519 kr, frakt enligt butiken. Till butik (öppnas i ny flik)
I lagerFrakt: se butikenDubbelkollad 06:28
519 kr
Lägst
- Bokus, 561 kr, frakt enligt butiken. Till butik (öppnas i ny flik)
I lagerFrakt: se butikenDubbelkollad 11:51
561 kr
- Akademibokhandeln, 569 kr, frakt enligt butiken. Till butik (öppnas i ny flik)
I lagerFrakt: se butikenDubbelkollad 11:53
569 kr
- Adlibris, 561 kr, frakt enligt butiken. Till butik (öppnas i ny flik)
Slut i lagerFrakt: se butikenDubbelkollad 12:10
561 kr



Priser från butikernas flöden kan ha ändrats: det är priset hos butiken som gäller, så kontrollera det innan du handlar.
Prishistorik
Köp nu eller vänta?
Just nu kostar produkten 519 kr — 85 kr över det lägsta vi sett på 1 månad.
Under den tiden har det oftast legat runt 520 kr.
Pris idag
519 kr
- Lägst
- 434 kr
- Snitt
- 509 kr
- Högst
- 561 kr
| 2026-09-02 | 519 kr · Lägst hos Buyersclub |
|---|---|
| 2026-09-13 | Ingen butik hade produkten i lager |
| 2026-09-15 | 554 kr · Lägst hos Bokus |
| 2026-09-18 | 561 kr · Lägst hos Bokus |
| 2026-09-26 | 519 kr · Lägst hos Buyersclub |
| 2026-10-09 | 435 kr · Lägst hos Bokus |
| 2026-10-17 | 434 kr · Lägst hos Bokus |
| 2026-10-20 | 519 kr · Lägst hos Buyersclub |
Om produkten
Data Visualization
Läs merLäs mindre
An accessible primer on how to create effective graphics from dataThis book provides students and researchers a hands-on introduction to the principles and practice of data visualization. It explains what makes some graphs succeed while others fail, how to make high-quality figures from data using powerful and reproducible methods, and how to think about data visualization in an honest and effective way.Data Visualization builds the reader's expertise in ggplot2, a versatile visualization library for the R programming language. Through a series of worked examples, this accessible primer then demonstrates how to create plots piece by piece, beginning with summaries of single variables and moving on to more complex graphics. Topics include plotting continuous and categorical variables; layering information on graphics; producing effective "small multiple" plots; grouping, summarizing, and transforming data for plotting; creating maps; working with the output of statistical models; and refining plots to make them more comprehensible.Effective graphics are essential to communicating ideas and a great way to better understand data. This book provides the practical skills students and practitioners need to visualize quantitative data and get the most out of their research findings.Provides hands-on instruction using R and ggplot2Shows how the "tidyverse" of data analysis tools makes working with R easier and more consistentIncludes a library of data sets, code, and functions
Specifikationer
Fakta
- Vikt
- 0,73 kg
- GTIN
- 09780691181622
Uppgifter från tillverkare och butiker.