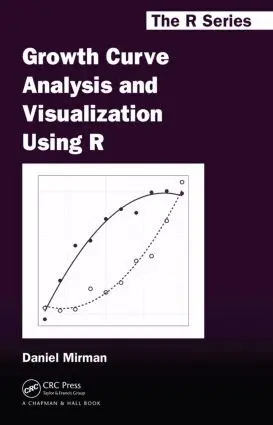
Growth Curve Analysis and Visualization Using R
- Vikt 0,41 kg
1 472 krhos Bokus · exkl. frakt
437 kr skillnad mellan billigaste och dyraste butik i lager
Dubbelkollat idag
Jämför 2 butiker
- Bokus, 1 472 kr, frakt enligt butiken. Till butik (öppnas i ny flik)
I lagerFrakt: se butikenDubbelkollad 07:51
1 472 kr
Lägst
- Akademibokhandeln, 1 909 kr, frakt enligt butiken. Till butik (öppnas i ny flik)
I lagerFrakt: se butikenDubbelkollad 07:53
1 909 kr

Priser från butikernas flöden kan ha ändrats: det är priset hos butiken som gäller, så kontrollera det innan du handlar.
Prishistorik
Köp nu eller vänta?
Just nu kostar produkten 1 472 kr — 20 kr över det lägsta vi sett på 1 månad.
Under den tiden har det oftast legat runt 1 460–1 480 kr.
Pris idag
1 472 kr
- Lägst
- 1 452 kr
- Snitt
- 1 470 kr
- Högst
- 1 487 kr
| 2026-09-15 | 1 464 kr · Lägst hos Bokus |
|---|---|
| 2026-09-17 | 1 459 kr · Lägst hos Bokus |
| 2026-09-19 | 1 458 kr · Lägst hos Bokus |
| 2026-09-20 | 1 454 kr · Lägst hos Bokus |
| 2026-09-23 | 1 456 kr · Lägst hos Bokus |
| 2026-09-25 | 1 452 kr · Lägst hos Bokus |
| 2026-09-30 | 1 453 kr · Lägst hos Bokus |
| 2026-10-02 | 1 462 kr · Lägst hos Bokus |
| 2026-10-03 | 1 464 kr · Lägst hos Bokus |
| 2026-10-04 | 1 469 kr · Lägst hos Bokus |
| 2026-10-05 | 1 471 kr · Lägst hos Bokus |
| 2026-10-08 | 1 485 kr · Lägst hos Bokus |
| 2026-10-10 | 1 483 kr · Lägst hos Bokus |
| 2026-10-12 | 1 474 kr · Lägst hos Bokus |
| 2026-10-16 | 1 483 kr · Lägst hos Bokus |
| 2026-10-17 | 1 479 kr · Lägst hos Bokus |
| 2026-10-18 | 1 478 kr · Lägst hos Bokus |
| 2026-10-20 | 1 477 kr · Lägst hos Bokus |
| 2026-10-22 | 1 475 kr · Lägst hos Bokus |
| 2026-10-24 | 1 481 kr · Lägst hos Bokus |
| 2026-10-27 | 1 484 kr · Lägst hos Bokus |
| 2026-10-28 | 1 487 kr · Lägst hos Bokus |
| 2026-10-29 | 1 486 kr · Lägst hos Bokus |
| 2026-11-01 | 1 472 kr · Lägst hos Bokus |
Om produkten
Growth Curve Analysis and Visualization Using R
Läs merLäs mindre
Learn How to Use Growth Curve Analysis with Your Time Course Data An increasingly prominent statistical tool in the behavioral sciences, multilevel regression offers a statistical framework for analyzing longitudinal or time course data. It also provides a way to quantify and analyze individual differences, such as developmental and neuropsychological, in the context of a model of the overall group effects. To harness the practical aspects of this useful tool, behavioral science researchers need a concise, accessible resource that explains how to implement these analysis methods.Growth Curve Analysis and Visualization Using R provides a practical, easy-to-understand guide to carrying out multilevel regression/growth curve analysis (GCA) of time course or longitudinal data in the behavioral sciences, particularly cognitive science, cognitive neuroscience, and psychology. With a minimum of statistical theory and technical jargon, the author focuses on the concrete issue of applying GCA to behavioral science data and individual differences. The book begins with discussing problems encountered when analyzing time course data, how to visualize time course data using the ggplot2 package, and how to format data for GCA and plotting. It then presents a conceptual overview of GCA and the core analysis syntax using the lme4 package and demonstrates how to plot model fits. The book describes how to deal with change over time that is not linear, how to structure random effects, how GCA and regression use categorical predictors, and how to conduct multiple simultaneous comparisons among different levels of a factor. It also compares the advantages and disadvantages of approaches to implementing logistic and quasi-logistic GCA and discusses how to use GCA to analyze individual differences as both fixed and random effects. The final chapter presents the code for all of the key examples along with samples demonstrating how to report GCA results.Throughout the book, R code illustrates how to implement the analyses and generate the graphs. Each chapter ends with exercises to test your understanding. The example datasets, code for solutions to the exercises, and supplemental code and examples are available on the author's website.
Specifikationer
Fakta
- Vikt
- 0,41 kg
- GTIN
- 09781466584327
Uppgifter från tillverkare och butiker.