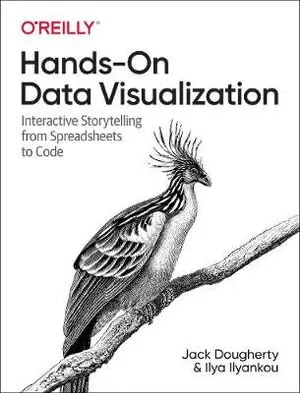
Hands-On Data Visualization
- Vikt 0,74 kg
510 krhos Bokus · exkl. frakt
149 kr skillnad mellan billigaste och dyraste butik i lager
Dubbelkollat idag
Jämför 2 butiker
- Bokus, 510 kr, frakt enligt butiken. Till butik (öppnas i ny flik)
I lagerFrakt: se butikenDubbelkollad 05:51
510 kr
Lägst
- Akademibokhandeln, 659 kr, frakt enligt butiken. Till butik (öppnas i ny flik)
I lagerFrakt: se butikenDubbelkollad 05:53
659 kr

Priser från butikernas flöden kan ha ändrats: det är priset hos butiken som gäller, så kontrollera det innan du handlar.
Prishistorik
Köp nu eller vänta?
Just nu kostar produkten 510 kr — 10 kr över det lägsta vi sett på 1 månad.
Under den tiden har det oftast legat runt 510 kr.
Pris idag
510 kr
- Lägst
- 500 kr
- Snitt
- 510 kr
- Högst
- 516 kr
| 2026-09-15 | 500 kr · Lägst hos Bokus |
|---|---|
| 2026-09-18 | 503 kr · Lägst hos Bokus |
| 2026-09-19 | 504 kr · Lägst hos Bokus |
| 2026-09-21 | 506 kr · Lägst hos Bokus |
| 2026-09-23 | 508 kr · Lägst hos Bokus |
| 2026-09-24 | 506 kr · Lägst hos Bokus |
| 2026-09-28 | 509 kr · Lägst hos Bokus |
| 2026-09-30 | 510 kr · Lägst hos Bokus |
| 2026-10-02 | 513 kr · Lägst hos Bokus |
| 2026-10-03 | 514 kr · Lägst hos Bokus |
| 2026-10-04 | 515 kr · Lägst hos Bokus |
| 2026-10-09 | 514 kr · Lägst hos Bokus |
| 2026-10-11 | 516 kr · Lägst hos Bokus |
| 2026-10-12 | 514 kr · Lägst hos Bokus |
| 2026-10-16 | 516 kr · Lägst hos Bokus |
| 2026-10-17 | 514 kr · Lägst hos Bokus |
| 2026-10-20 | 511 kr · Lägst hos Bokus |
| 2026-10-22 | 510 kr · Lägst hos Bokus |
| 2026-10-27 | 511 kr · Lägst hos Bokus |
| 2026-10-28 | 513 kr · Lägst hos Bokus |
| 2026-11-01 | 510 kr · Lägst hos Bokus |
Om produkten
Hands-On Data Visualization
Läs merLäs mindre
Tell your story and show it with data, using free and easy-to-learn tools on the web. This introductory book teaches you how to design interactive charts and customized maps for your website, beginning with simple drag-and-drop tools such as Google Sheets, Datawrapper, and Tableau Public. You'll also gradually learn how to edit open source code templates like Chart.js, Highcharts, and Leaflet on GitHub. Hands-On Data Visualization takes you step-by-step through tutorials, real-world examples, and online resources. This hands-on resource is ideal for students, nonprofit organizations, small business owners, local governments, journalists, academics, and anyone who wants to take data out of spreadsheets and turn it into lively interactive stories. No coding experience is required.Build interactive charts and maps and embed them in your website Understand the principles for designing effective charts and mapsLearn key data visualization concepts to help you choose the right toolsConvert and transform tabular and spatial data to tell your data storyEdit and host Chart.js, Highcharts, and Leaflet map code templates on GitHub Learn how to detect bias in charts and maps produced by others
Specifikationer
Fakta
- Vikt
- 0,74 kg
- GTIN
- 09781492086000
Uppgifter från tillverkare och butiker.