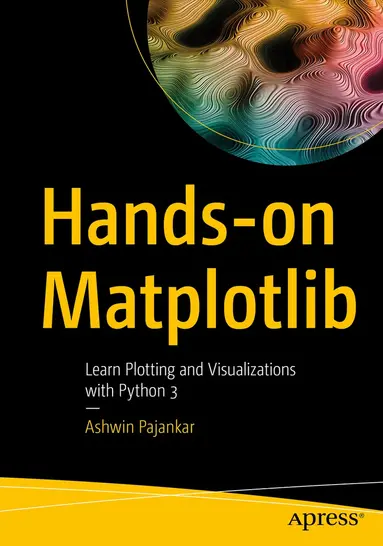
Hands-on Matplotlib
- Vikt 0,61 kg
Bra pris nuLägsta priset på 1 månad
668 kr671 kr−0% senaste veckanhos Bokus · exkl. frakt
Jämfört med det lägsta pris vi sett de 30 dagarna före sänkningen.
201 kr skillnad mellan billigaste och dyraste butik i lager
Dubbelkollat idag
Jämför 2 butiker
- Bokus, 668 kr, frakt enligt butiken. Till butik (öppnas i ny flik)
I lagerFrakt: se butikenDubbelkollad 05:51
668 kr
Lägst
- Akademibokhandeln, 869 kr, frakt enligt butiken. Till butik (öppnas i ny flik)
I lagerFrakt: se butikenDubbelkollad 05:53
869 kr

Priser från butikernas flöden kan ha ändrats: det är priset hos butiken som gäller, så kontrollera det innan du handlar.
Prishistorik
Köp nu eller vänta?
Just nu kostar produkten 668 kr — det lägsta vi sett på 1 månad.
Under den tiden har det oftast legat runt 680 kr.
Pris idag
668 kr
- Lägst
- 668 kr
- Snitt
- 679 kr
- Högst
- 691 kr
| 2026-09-15 | 691 kr · Lägst hos Bokus |
|---|---|
| 2026-09-17 | 681 kr · Lägst hos Bokus |
| 2026-09-20 | 680 kr · Lägst hos Bokus |
| 2026-09-23 | 682 kr · Lägst hos Bokus |
| 2026-09-24 | 681 kr · Lägst hos Bokus |
| 2026-09-25 | 679 kr · Lägst hos Bokus |
| 2026-09-28 | 681 kr · Lägst hos Bokus |
| 2026-09-30 | 682 kr · Lägst hos Bokus |
| 2026-10-02 | 684 kr · Lägst hos Bokus |
| 2026-10-04 | 685 kr · Lägst hos Bokus |
| 2026-10-09 | 680 kr · Lägst hos Bokus |
| 2026-10-10 | 678 kr · Lägst hos Bokus |
| 2026-10-12 | 676 kr · Lägst hos Bokus |
| 2026-10-13 | 675 kr · Lägst hos Bokus |
| 2026-10-16 | 677 kr · Lägst hos Bokus |
| 2026-10-17 | 674 kr · Lägst hos Bokus |
| 2026-10-19 | 675 kr · Lägst hos Bokus |
| 2026-10-20 | 674 kr · Lägst hos Bokus |
| 2026-10-22 | 671 kr · Lägst hos Bokus |
| 2026-10-24 | 674 kr · Lägst hos Bokus |
| 2026-10-27 | 675 kr · Lägst hos Bokus |
| 2026-10-28 | 676 kr · Lägst hos Bokus |
| 2026-11-01 | 668 kr · Lägst hos Bokus |
Om produkten
Hands-on Matplotlib
Läs merLäs mindre
Learn the core aspects of NumPy, Matplotlib, and Pandas, and use them to write programs with Python 3. This book focuses heavily on various data visualization techniques and will help you acquire expert-level knowledge of working with Matplotlib, a MATLAB-style plotting library for Python programming language that provides an object-oriented API for embedding plots into applications. You'll begin with an introduction to Python 3 and the scientific Python ecosystem. Next, you'll explore NumPy and ndarray data structures, creation routines, and data visualization. You'll examine useful concepts related to style sheets, legends, and layouts, followed by line, bar, and scatter plots. Chapters then cover recipes of histograms, contours, streamplots, and heatmaps, and how to visualize images and audio with pie and polar charts. Moving forward, you'll learn how to visualize with pcolor, pcolormesh, and colorbar, and how to visualize in 3D in Matplotlib, create simple animations, and embed Matplotlib with different frameworks. The concluding chapters cover how to visualize data with Pandas and Matplotlib, Seaborn, and how to work with the real-life data and visualize it. After reading Hands-on Matplotlib you'll be proficient with Matplotlib and able to comfortably work with ndarrays in NumPy and data frames in Pandas. What You'll LearnUnderstand Data Visualization and Python using MatplotlibReview the fundamental data structures in NumPy and Pandas Work with 3D plotting, visualizations, and animationsVisualize images and audio dataWho This Book Is ForData scientists, machine learning engineers and software professionals with basic programming skills.
Specifikationer
Fakta
- Vikt
- 0,61 kg
- GTIN
- 09781484274095
Uppgifter från tillverkare och butiker.