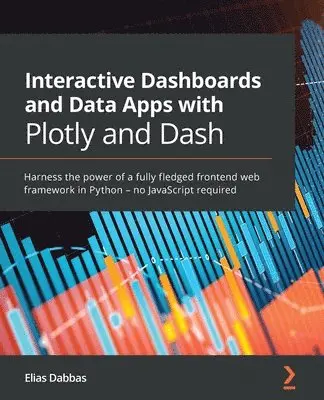
Interactive Dashboards and Data Apps with Plotly and Dash
- Vikt 0,68 kg
720 krhos Bokus · exkl. frakt
219 kr skillnad mellan billigaste och dyraste butik i lager
Dubbelkollat idag
Jämför 2 butiker
- Bokus, 720 kr, frakt enligt butiken. Till butik (öppnas i ny flik)
I lagerFrakt: se butikenDubbelkollad 09:51
720 kr
Lägst
- Akademibokhandeln, 939 kr, frakt enligt butiken. Till butik (öppnas i ny flik)
I lagerFrakt: se butikenDubbelkollad 09:53
939 kr

Priser från butikernas flöden kan ha ändrats: det är priset hos butiken som gäller, så kontrollera det innan du handlar.
Prishistorik
Köp nu eller vänta?
Just nu kostar produkten 720 kr — 15 kr över det lägsta vi sett på 1 månad.
Pris idag
720 kr
- Lägst
- 705 kr
- Snitt
- 712 kr
- Högst
- 720 kr
| 2026-09-15 | 705 kr · Lägst hos Bokus |
|---|---|
| 2026-10-12 | 720 kr · Lägst hos Bokus |
Om produkten
Interactive Dashboards and Data Apps with Plotly and Dash
Läs merLäs mindre
Build web-based, mobile-friendly analytic apps and interactive dashboards with PythonKey FeaturesDevelop data apps and dashboards without any knowledge of JavaScriptMap different types of data such as integers, floats, and dates to bar charts, scatter plots, and moreCreate controls and visual elements with multiple inputs and outputs and add functionality to the app as per your requirementsBook DescriptionPlotly's Dash framework is a life-saver for Python developers who want to develop complete data apps and interactive dashboards without JavaScript, but you'll need to have the right guide to make sure you're getting the most of it. With the help of this book, you'll be able to explore the functionalities of Dash for visualizing data in different ways.Interactive Dashboards and Data Apps with Plotly and Dash will first give you an overview of the Dash ecosystem, its main packages, and the third-party packages crucial for structuring and building different parts of your apps. You'll learn how to create a basic Dash app and add different features to it.Next, you'll integrate controls such as dropdowns, checkboxes, sliders, date pickers, and more in the app and then link them to charts and other outputs. Depending on the data you are visualizing, you'll also add several types of charts, including scatter plots, line plots, bar charts, histograms, and maps, as well as explore the options available for customizing them.By the end of this book, you'll have developed the skills you need to create and deploy an interactive dashboard, handle complexities and code refactoring, and understand the process of improving your application.What you will learnFind out how to run a fully interactive and easy-to-use appConvert your charts to various formats including images and HTML filesUse Plotly Express and the grammar of graphics for easily mapping data to various visual attributesCreate different chart types, such as bar charts, scatter plots, histograms, maps, and moreExpand your app by creating dynamic pages that generate content based on URLsImplement new callbacks to manage charts based on URLs and vice versaWho this book is forThis Plotly Dash book is for data professionals and data analysts who want to gain a better understanding of their data with the help of different visualizations and dashboards - and without having to use JS. Basic knowledge of the Python programming language and HTML will help you to grasp the concepts covered in this book more effectively, but it's not a prerequisite.
Specifikationer
Fakta
- Vikt
- 0,68 kg
- GTIN
- 09781800568914
Uppgifter från tillverkare och butiker.