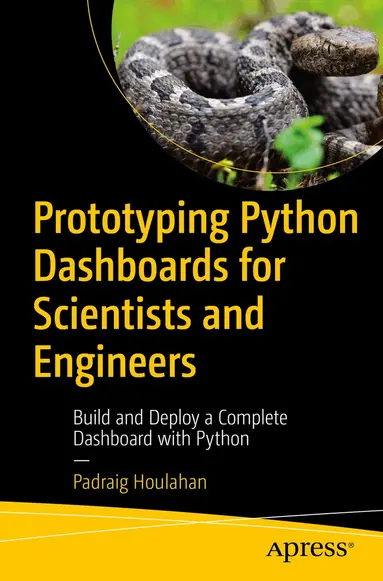
Prototyping Python Dashboards for Scientists and Engineers
- Vikt 0,36 kg
495 krhos Bokus · exkl. frakt
144 kr skillnad mellan billigaste och dyraste butik i lager
Dubbelkollat idag
Jämför 2 butiker
- Bokus, 495 kr, frakt enligt butiken. Till butik (öppnas i ny flik)
I lagerFrakt: se butikenDubbelkollad 05:51
495 kr
Lägst
- Akademibokhandeln, 639 kr, frakt enligt butiken. Till butik (öppnas i ny flik)
I lagerFrakt: se butikenDubbelkollad 05:53
639 kr

Priser från butikernas flöden kan ha ändrats: det är priset hos butiken som gäller, så kontrollera det innan du handlar.
Prishistorik
Köp nu eller vänta?
Just nu kostar produkten 495 kr — 10 kr över det lägsta vi sett på 1 månad.
Pris idag
495 kr
- Lägst
- 485 kr
- Snitt
- 490 kr
- Högst
- 495 kr
| 2026-09-15 | 485 kr · Lägst hos Bokus |
|---|---|
| 2026-10-10 | 495 kr · Lägst hos Bokus |
Om produkten
Create interactive and data-driven dashboards using Python
Läs merLäs mindre
This hands-on guide is a practical resource for those (with modest programming skills) in scientific and engineering fields looking to leverage Python's power for data visualization and analysis in a user-friendly dashboard format.You'll begin by gaining a fundamental understanding of Python programming, including data types, lists, dictionaries, and data structures. The book then delves into the world of reactive programming with Plotly and Dash, offering a hands-on approach to building interactive web-based dashboards. Next, you'll see how to work with online data, how to scrape and clean datasets, and keep files up-to-date. The book also guides you through planning a dashboard prototype, outlining project tasks, trends, forecasts, spectra, and other design considerations. It concludes with a discussion of how the dashboard can be used for data visualization of real data, explaining the usefulness of tools such as spectra.By providing detailed examples for download and customization, Prototyping Python Dashboards for Scientists and Engineers will equip you with the skills needed to jumpstart your own development efforts.What You'll LearnDesign a dashboard with PythonConvert and filter Excel formatted files to produce CSV filesCreate browser-served graphics with PLOTLYGenerate polynomial trend lines for forecastingBuild a Unix service to share your dashboardWho This Book Is ForScientists, engineers, students, programmers, and data enthusiasts who aspire to harness Python's potential for data visualization and analysis through the creation of interactive dashboards. Many will be pragmatic programmers with modest skills and limited resources who mainly want to see a working solution they could emulate.
Specifikationer
Fakta
- Vikt
- 0,36 kg
- GTIN
- 09798868802201
Uppgifter från tillverkare och butiker.