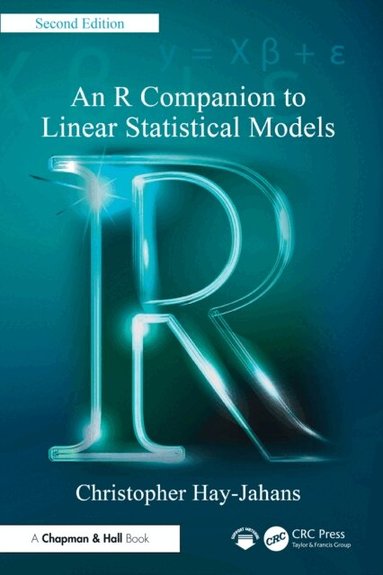
R Companion to Linear Statistical Models
Dubbelkollat idag
Jämför 1 butik
- Bokus, 1 507 kr, frakt enligt butiken. Till butik (öppnas i ny flik)
I lagerFrakt: se butikenDubbelkollad 16:51
1 507 kr
Lägst

Priser från butikernas flöden kan ha ändrats: det är priset hos butiken som gäller, så kontrollera det innan du handlar.
Prishistorik
Köp nu eller vänta?
Just nu kostar produkten 1 507 kr — 33 kr över det lägsta vi sett på 2 veckor.
Pris idag
1 507 kr
- Lägst
- 1 474 kr
- Snitt
- 1 497 kr
- Högst
- 1 507 kr
| 2026-10-01 | 1 474 kr · Lägst hos Bokus |
|---|---|
| 2026-10-06 | 1 507 kr · Lägst hos Bokus |
Om produkten
R Companion to Linear Statistical Models
Läs merLäs mindre
Taking advantage of both user-developed code and specialized functions, this second edition of An R Companion to Linear Statistical Models again targets two primary audiences: Those who are familiar with the introductory theory and applications of linear statistical models and who wish to learn how to use R in this area, or explore further ideas that might appear in this Companion; and those who are enrolled in an intermediate to advanced level course on linear statistical models for which R is the computational platform.This Companion includes accessible introductions to writing R code as well as making use of functions through relevant examples. These examples cover methods used for linear regression and designed experiments with up to two fixed-effects factors, including blocking variables and covariates. Also included in this edition is a new part containing chapters that revisit the one-factor fixed-effects model from alternative points of view, and provide introductions to applying R to nonstandard linear contrasts, one-factor random-effects and repeated-measures designs, weighted least squares, and modelling with binary response data. Key Features Demonstrates how to create user-defined functions, and how to use pre-packaged functions from the Comprehensive R Archive Network (CRAN) as well as functions prepared specifically for this Companion. Has carefully documented accompanying R script files that follow along with the discussions in the book, and also contain additional exploratory code. Makes use of a relevant collection of examples to demonstrate both the statistical methods being discussed, as well as the R code used implement the methods. Provides detailed interpretations and explanations of graphical tools used, computed model parameter estimates, associated tests, and common "e;rules of thumb"e; used in interpreting graphs and computational output. Limits statistical and mathematical background theory to that which aids in following computational methods.