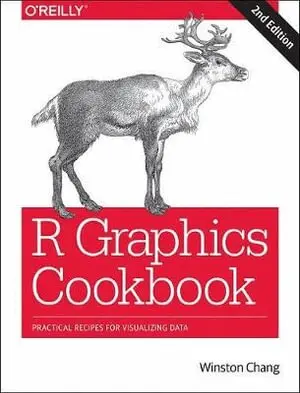
R Graphics Cookbook
- Vikt 0,7 kg
616 krhos Bokus · exkl. frakt
183 kr skillnad mellan billigaste och dyraste butik i lager
Dubbelkollade priser
Jämför 3 butiker
- Bokus, 616 kr, frakt enligt butiken. Till butik (öppnas i ny flik)
I lagerFrakt: se butikenDubbelkollad 05:51
616 kr
Lägst
- Akademibokhandeln, 799 kr, frakt enligt butiken. Till butik (öppnas i ny flik)
I lagerFrakt: se butikenDubbelkollad 05:53
799 kr
- Adlibris, 700 kr, frakt enligt butiken. Till butik (öppnas i ny flik)
Slut i lagerFrakt: se butikenDubbelkollad 27 okt. 09:10
700 kr


Priser från butikernas flöden kan ha ändrats: det är priset hos butiken som gäller, så kontrollera det innan du handlar.
Prishistorik
Köp nu eller vänta?
Just nu kostar produkten 616 kr — 12 kr över det lägsta vi sett på 1 månad.
Under den tiden har det oftast legat runt 610–620 kr.
Pris idag
616 kr
- Lägst
- 604 kr
- Snitt
- 617 kr
- Högst
- 626 kr
| 2026-09-15 | 604 kr · Lägst hos Bokus |
|---|---|
| 2026-09-18 | 609 kr · Lägst hos Bokus |
| 2026-09-20 | 610 kr · Lägst hos Bokus |
| 2026-09-21 | 612 kr · Lägst hos Bokus |
| 2026-09-23 | 614 kr · Lägst hos Bokus |
| 2026-09-24 | 612 kr · Lägst hos Bokus |
| 2026-09-25 | 611 kr · Lägst hos Bokus |
| 2026-09-28 | 616 kr · Lägst hos Bokus |
| 2026-10-02 | 620 kr · Lägst hos Bokus |
| 2026-10-03 | 622 kr · Lägst hos Bokus |
| 2026-10-10 | 626 kr · Lägst hos Bokus |
| 2026-10-12 | 621 kr · Lägst hos Bokus |
| 2026-10-16 | 624 kr · Lägst hos Bokus |
| 2026-10-17 | 622 kr · Lägst hos Bokus |
| 2026-10-20 | 618 kr · Lägst hos Bokus |
| 2026-10-22 | 617 kr · Lägst hos Bokus |
| 2026-10-24 | 616 kr · Lägst hos Bokus |
| 2026-10-27 | 618 kr · Lägst hos Bokus |
| 2026-10-28 | 620 kr · Lägst hos Bokus |
| 2026-10-30 | 621 kr · Lägst hos Bokus |
| 2026-11-01 | 616 kr · Lägst hos Bokus |
Om produkten
R Graphics Cookbook
Läs merLäs mindre
This O'Reilly cookbook provides more than 150 recipes to help scientists, engineers, programmers, and data analysts generate high-quality graphs quickly-without having to comb through all the details of R's graphing systems. Each recipe tackles a specific problem with a solution you can apply to your own project and includes a discussion of how and why the recipe works. Most of the recipes in this second edition use the updated version of the ggplot2 package, a powerful and flexible way to make graphs in R. You'll also find expanded content about the visual design of graphics. If you have at least a basic understanding of the R language, you're ready to get started with this easy-to-use reference. Use R's default graphics for quick exploration of data Create a variety of bar graphs, line graphs, and scatter plots Summarize data distributions with histograms, density curves, box plots, and more Provide annotations to help viewers interpret data Control the overall appearance of graphics Explore options for using colors in plots Create network graphs, heat maps, and 3D scatter plots Get your data into shape using packages from the tidyverse
Specifikationer
Fakta
- Vikt
- 0,7 kg
- GTIN
- 09781491978603
Uppgifter från tillverkare och butiker.