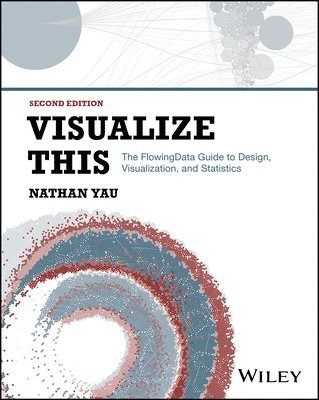
Visualize This
- Vikt 0,75 kg
345 krhos Bokus · exkl. frakt
104 kr skillnad mellan billigaste och dyraste butik i lager
Dubbelkollat idag
Jämför 5 butiker
- Bokus, 345 kr, frakt enligt butiken. Till butik (öppnas i ny flik)
I lagerFrakt: se butikenDubbelkollad 17:51
345 kr
Lägst
- Storytel Books, 349 kr, frakt enligt butiken. Till butik (öppnas i ny flik)
I lagerFrakt: se butikenDubbelkollad 18:00
349 kr
- Buyersclub, 399 kr, frakt enligt butiken. Till butik (öppnas i ny flik)
I lagerFrakt: se butikenDubbelkollad 06:28
399 kr
- Akademibokhandeln, 449 kr, frakt enligt butiken. Till butik (öppnas i ny flik)
I lagerFrakt: se butikenDubbelkollad 17:53
449 kr
- Adlibris, 414 kr, frakt enligt butiken. Till butik (öppnas i ny flik)
Slut i lagerFrakt: se butikenDubbelkollad 18:10
414 kr




Priser från butikernas flöden kan ha ändrats: det är priset hos butiken som gäller, så kontrollera det innan du handlar.
Prishistorik
Köp nu eller vänta?
Just nu kostar produkten 345 kr — 8 kr över det lägsta vi sett på 1 månad.
Under den tiden har det oftast legat runt 340–400 kr.
Pris idag
345 kr
- Lägst
- 337 kr
- Snitt
- 359 kr
- Högst
- 399 kr
| 2026-09-02 | 399 kr · Lägst hos Buyersclub |
|---|---|
| 2026-09-15 | 337 kr · Lägst hos Bokus |
| 2026-09-18 | 340 kr · Lägst hos Bokus |
| 2026-09-21 | 342 kr · Lägst hos Bokus |
| 2026-09-23 | 343 kr · Lägst hos Bokus |
| 2026-09-24 | 341 kr · Lägst hos Bokus |
| 2026-09-28 | 344 kr · Lägst hos Bokus |
| 2026-10-03 | 347 kr · Lägst hos Bokus |
| 2026-10-05 | 349 kr · Lägst hos Bokus |
| 2026-10-08 | 358 kr · Lägst hos Bokus |
| 2026-10-09 | 350 kr · Lägst hos Bokus |
| 2026-10-11 | 358 kr · Lägst hos Bokus |
| 2026-10-12 | 347 kr · Lägst hos Bokus |
| 2026-10-16 | 349 kr · Lägst hos Storytel Books |
| 2026-10-17 | 347 kr · Lägst hos Bokus |
| 2026-10-20 | 345 kr · Lägst hos Bokus |
Om produkten
Visualize This
Läs merLäs mindre
One of the most influential data visualization books-updated with new techniques, technologies, and examples Visualize This demonstrates how to explain data visually, so that you can present and communicate information in a way that is appealing and easy to understand. Today, there is a continuous flow of data available to answer almost any question. Thoughtful charts, maps, and analysis can help us make sense of this data. But the data does not speak for itself. As leading data expert Nathan Yau explains in this book, graphics provide little value unless they are built upon a firm understanding of the data behind them. Visualize This teaches you a data-first approach from a practical point of view. You'll start by exploring what your data has to say, and then you'll design visualizations that are both remarkable and meaningful. With this book, you'll discover what tools are available to you without becoming overwhelmed with options. You'll be exposed to a variety of software and code and jump right into real-world datasets so that you can learn visualization by doing. You'll learn to ask and answer questions with data, so that you can make charts that are both beautiful and useful. Visualize This also provides you with opportunities to apply what you learn to your own data. This completely updated, full-color second edition: Presents a unique approach to visualizing and telling stories with data, from data visualization expert Nathan YauOffers step-by-step tutorials and practical design tips for creating statistical graphics, geographical maps, and information designDetails tools that can be used to visualize data graphics for reports, presentations, and stories, for the web or for print, with major updates for the latest R packages, Python libraries, JavaScript libraries, illustration software, and point-and-click applicationsContains numerous examples and descriptions of patterns and outliers and explains how to show them Information designers, analysts, journalists, statisticians, data scientists-as well as anyone studying for careers in these fields-will gain a valuable background in the concepts and techniques of data visualization, thanks to this legendary book.
Specifikationer
Fakta
- Vikt
- 0,75 kg
- GTIN
- 09781394214860
Uppgifter från tillverkare och butiker.